
The ICE scoring model is one of the fastest ways to rank a list of ideas. You give each idea three scores (Impact, Confidence and Ease) and the highest total goes first. It takes minutes, which is why growth and product teams like it.
It’s also easy to get wrong. Most ICE scores are opinions written as numbers. This guide covers how ICE works, where it breaks, and how to anchor each score in evidence you already have: revenue, product usage and your codebase. There’s a worked example and a free template at the end.
What is the ICE scoring model?
ICE was popularised by Sean Ellis for ranking growth experiments. It has since spread to feature prioritisation. Each idea gets three scores from 1 to 10:
- Impact: how much this moves the goal you care about.
- Confidence: how sure you are that the impact estimate is right.
- Ease: how cheap and low-risk it is to ship.
How to calculate an ICE score
There are two common conventions:
- Multiply: ICE = Impact × Confidence × Ease (range 1 to 1,000).
- Average: ICE = (Impact + Confidence + Ease) ÷ 3 (range 1 to 10).
Pick one and stick with it. Multiplying punishes a weak score harder: a 2 on any factor drags the whole idea down. That’s usually what you want, because an idea that’s huge but nearly impossible shouldn’t sneak to the top. This guide multiplies.
Where ICE goes wrong
ICE’s speed is also its weakness. The common failure modes:
- Impact is scored on noise. Ten loud requests feel like high impact, even when the accounts behind them are small or barely use the product.
- Confidence is a mood. Without a definition, “7” means “I quite like this idea.”
- Ease is guessed by the wrong person. PMs score Ease without checking what the code actually looks like.
- Symptoms get scored instead of problems. “Add custom dashboards” might really be “I can’t see overdue invoices.” Score the request and you’ll build the wrong thing.
The fix isn’t a fancier formula. It’s giving every score a source.
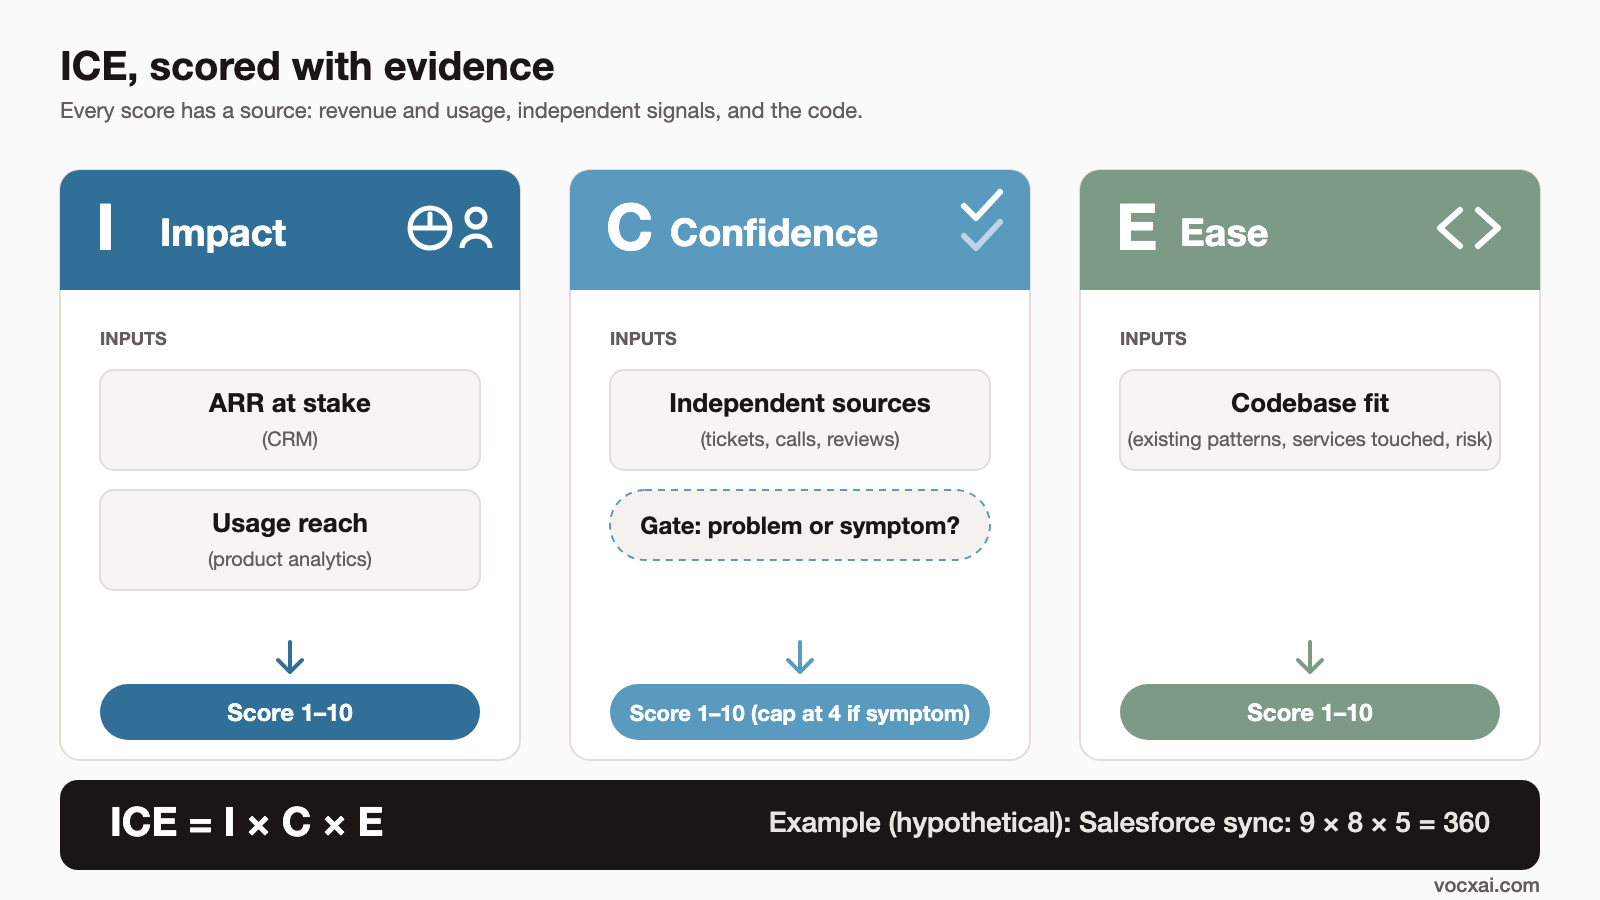
Grounding each score in evidence
Impact: ARR at stake plus usage reach
Two inputs, both measurable:
- ARR at stake: the total annual recurring revenue of accounts asking for this, or blocked without it. Pull it from your CRM (Salesforce, HubSpot). Weight renewals and deals that cite it explicitly.
- Usage reach: the share of active accounts that touch the affected workflow. Product analytics like Amplitude will tell you this in a few minutes.
A simple anchor table keeps scorers consistent:
| Impact score | ARR at stake (example bands) | Usage reach (share of weekly active accounts) |
|---|---|---|
| 1–2 | < $10k | < 2% |
| 3–4 | $10k–$50k | 2–5% |
| 5–6 | $50k–$120k | 5–15% |
| 7–8 | $120k–$250k | 15–30% |
| 9–10 | > $250k or a named renewal at risk | > 30% |
When the two bands disagree, pick the score that fits the goal you’re prioritising for this cycle (retention, expansion or activation), and write down why. Adjust the bands to your business size.
Confidence: independent evidence, and problem vs symptom
Confidence should go up with the number of independent sources that point the same way, and down when you’re not sure you’ve found the underlying problem.
| Confidence score | What it takes |
|---|---|
| 1–2 | One person’s opinion or a single request |
| 3–4 | Several requests from one channel (e.g. only the voting board) |
| 5–6 | Two independent sources (e.g. support tickets plus sales calls) |
| 7–8 | Three or more sources, plus usage data that confirms the behaviour |
| 9–10 | All of the above, plus a prototype test or a past launch that showed the effect |
Then ask one question: is this the problem, or a symptom of it? If customers ask for a feature, look at what they’re trying to get done. If you can’t state the underlying problem in one sentence, cap Confidence at 4.
Ease: codebase fit, not gut feel
Ease should come from engineering, informed by the actual code:
- Does a similar pattern already exist (a connector, an export service, an auth library)?
- How many services or components does it touch?
- Are there migrations, permissions or security reviews involved?
| Ease score | Rough guide |
|---|---|
| 1–2 | New architecture, many services, high risk |
| 3–4 | Several weeks, touches core models |
| 5–6 | Existing pattern to follow, moderate scope |
| 7–8 | Small change in one area, mostly reuse |
| 9–10 | Config or copy change |
Worked example: gut feel vs evidence
This is a hypothetical example. Imagine a B2B invoicing app with about $3M ARR. The team has five candidate features for next quarter.
Round 1: gut-feel scores
The team scores in a meeting, from memory.
| Feature | Impact | Confidence | Ease | ICE (I×C×E) | Rank |
|---|---|---|---|---|---|
| Dark mode | 8 | 7 | 8 | 448 | 1 |
| Bulk CSV export | 5 | 6 | 7 | 210 | 2 |
| SAML single sign-on | 7 | 6 | 4 | 168 | 3 |
| Custom dashboards | 9 | 6 | 3 | 162 | 4 |
| Salesforce sync | 6 | 5 | 3 | 90 | 5 |
Dark mode wins easily. It’s the most upvoted item on the feedback board and everyone likes it.
Round 2: evidence-based scores
Now the team pulls the data before scoring.
- Dark mode: 14 accounts, $21k ARR at stake. About 3% of weekly active accounts have asked. Only one source (the voting board). Hard-coded colours across about 180 components make it less easy than it looked. I 3, C 4, E 6.
- Bulk CSV export: 22 accounts, $140k ARR. Amplitude shows 31% of weekly active accounts exporting invoices one at a time every week. The real problem is getting data into their accounting software, and tickets and calls agree. An export service already exists. I 7, C 7, E 8.
- SAML SSO: 6 accounts, but $260k ARR, plus enterprise deals stalled at security review. Low reach (4%). Strong evidence from security questionnaires and sales notes. The auth library supports SAML. I 7, C 8, E 5.
- Custom dashboards: 11 accounts, $95k ARR. The existing dashboard is viewed by only 8% of accounts. Digging into the requests shows most people want one missing metric: days overdue. That’s a symptom, so Confidence is capped. Building a dashboard builder is a big job. I 5, C 3, E 2.
- Salesforce sync: 9 accounts, $310k ARR, and two renewals mention it in writing. Reach is 12%, and sales calls, churn notes and support tickets all point the same way. A HubSpot sync already exists to copy. I 9, C 8, E 5.
| Feature | Impact | Confidence | Ease | ICE (I×C×E) | Rank | Gut-feel rank |
|---|---|---|---|---|---|---|
| Bulk CSV export | 7 | 7 | 8 | 392 | 1 | 2 |
| Salesforce sync | 9 | 8 | 5 | 360 | 2 | 5 |
| SAML single sign-on | 7 | 8 | 5 | 280 | 3 | 3 |
| Dark mode | 3 | 4 | 6 | 72 | 4 | 1 |
| Custom dashboards | 5 | 3 | 2 | 30 | 5 | 4 |
Maths check: 7×7×8 = 392; 9×8×5 = 360; 7×8×5 = 280; 3×4×6 = 72; 5×3×2 = 30.
What changed: the gut-feel winner, dark mode, falls to fourth. Salesforce sync jumps from last to second because $310k ARR and two at-risk renewals were invisible in the meeting. And custom dashboards turns out to be a symptom: shipping a “days overdue” metric on the existing dashboard is a much smaller job that solves the real problem.
ICE vs RICE vs MoSCoW
| ICE | RICE | MoSCoW | |
|---|---|---|---|
| Inputs | Impact, Confidence, Ease | Reach, Impact, Confidence, Effort | Category: Must, Should, Could, Won’t |
| Maths | I × C × E (or average) | (R × I × C) ÷ Effort | None; it’s a classification |
| Output | Ranked list | Ranked list | Grouped scope for a release |
| Best for | Fast ranking of many ideas, experiments | Features where reach varies a lot | Agreeing scope for a fixed deadline |
| Main risk | Subjective scores | False precision in Reach and Effort | Everything becomes a Must |
| Make it better with | Evidence-anchored scales | Real usage data for Reach | A 60/20/20 effort cap and evidence for Musts |
ICE folds reach into Impact. RICE separates it, which helps when one idea affects a few big accounts and another affects many small ones. For the full RICE method, see our RICE scoring model guide. For a visual way to compare value against effort, try the feature prioritisation matrix template. For fixed-deadline scoping, see our guide to MoSCoW prioritisation.
Calibration and anti-bias tips
- Score separately, then compare. Have each person score on their own before the meeting. Discuss only the big gaps.
- Use the anchor tables. A “7” should mean the same thing to everyone.
- Write the evidence next to the score. One line each: “$310k ARR, 2 renewals, 12% reach.”
- Let engineering own Ease. Ideally after a quick look at the code.
- Watch the loudest-customer effect. Check ARR and reach before reacting to volume.
- Re-score on a schedule. Scores go stale. Re-run ICE monthly or when big new evidence lands.
- Calibrate against outcomes. After shipping, compare the predicted Impact with what actually happened, and tighten your bands.
Free ICE scoring template
Download the ICE scoring template (XLSX) or the CSV version. It includes the anchor tables, an evidence column for each score, and formulas for the ICE score and rank. The example above is pre-filled so you can see how it works.
How VocxAI automates this
Pulling ARR from the CRM, reach from Amplitude, and evidence from tickets and calls by hand takes time, which is why most teams skip it. VocxAI does it automatically. It connects feedback, usage and revenue data, works out whether a request is the underlying problem or a symptom, and checks how well a change fits your codebase. You get evidence-backed Impact, Confidence and Ease without the spreadsheet work. There’s a free tier if you want to try it on your own backlog.
FAQ
What does ICE stand for?
Impact, Confidence and Ease. Each is scored from 1 to 10, and the scores are combined into one number used to rank ideas.
Should I multiply or average ICE scores?
Either works if you’re consistent. Multiplying (1–1,000) penalises any weak factor more heavily. Averaging (1–10) is gentler and easier to read. Most product teams multiply.
What’s the difference between ICE and RICE?
RICE adds Reach as a separate factor and divides by Effort instead of multiplying by Ease. Use RICE when the number of affected users varies a lot between ideas, and ICE when you need a quick ranking.
How do I make ICE less subjective?
Define each score with an anchor table, and tie it to evidence: ARR at stake and usage reach for Impact, the number of independent sources for Confidence, and an engineering read of the code for Ease.
When should I use ICE?
ICE works well for growth experiments, early-stage products, and quickly cutting a long list down to a shortlist. For a fixed-deadline release, pair it with MoSCoW to agree scope.
How often should we re-score?
Monthly is a good default, or whenever significant new evidence arrives, such as a renewal at risk or a usage spike.
See how VocxAI builds this for you
VocxAI is the AI agent that keeps improving your product: it finds the patterns in customer feedback from any tool you use, works out what's wrong in your code, has AI agents build the fix for your approval, then checks whether it worked and acts on what it learns.
Sign up for free